How many people come to the UK each year?
Published 24 May 2018

© Crown copyright 2018
This publication is licensed under the terms of the Open Government Licence v3.0 except where otherwise stated. To view this licence, visit nationalarchives.gov.uk/doc/open-government-licence/version/3 or write to the Information Policy Team, The National Archives, Kew, London TW9 4DU, or email: psi@nationalarchives.gov.uk.
Where we have identified any third party copyright information you will need to obtain permission from the copyright holders concerned.
This publication is available at https://www.gov.uk/government/statistics/immigration-statistics-year-ending-march-2018/how-many-people-come-to-the-uk-each-year
Back to ‘Immigration Statistics, year ending March 2018’ content page.
This is not the latest release. View latest release.
Data relate to the year ending March 2018 and all comparisons are with the year ending March 2017, unless indicated otherwise.
This section contains data on:
- the number of arrivals by people entering the UK (where an individual enters the country more than once, each arrival is counted); for non-EEA nationals subject to immigration control, more detailed information is available on their nationality and purpose of their journey
- grants of Entry clearance visas to individuals outside the UK; including dependants unless stated otherwise
We provide a more detailed commentary on an annual basis. This is included in ‘Immigration Statistics, April to June 2017’.
1. Key facts
There were 137.9 million passenger arrivals in the year ending March 2018, including returning UK residents, an increase of 6.0 million compared to the previous year - a record number. This increase was divided between:
- 3.1 million more arrivals by British, other EEA and Swiss nationals (up 3% to 118.0 million)
- 2.9 million more by non-EEA nationals (up 17% to 19.9 million)
The latest available data estimating the number of EEA and Swiss nationals entering the UK is for the year end September 2017 and shows there were 39.8 million such arrivals.
These numbers represent the number of occasions when a person entered the UK, not the number of distinct individuals.
The majority of non-EEA visitors do not require a visa. For other visitors and for other purposes, there were over 2.7 million visas granted in the year ending March 2018. Of these, nearly 2.1 million (77%) were to visit and 8% were for study.
Passenger arrivals to the UK, by nationality, 2008 to 2017
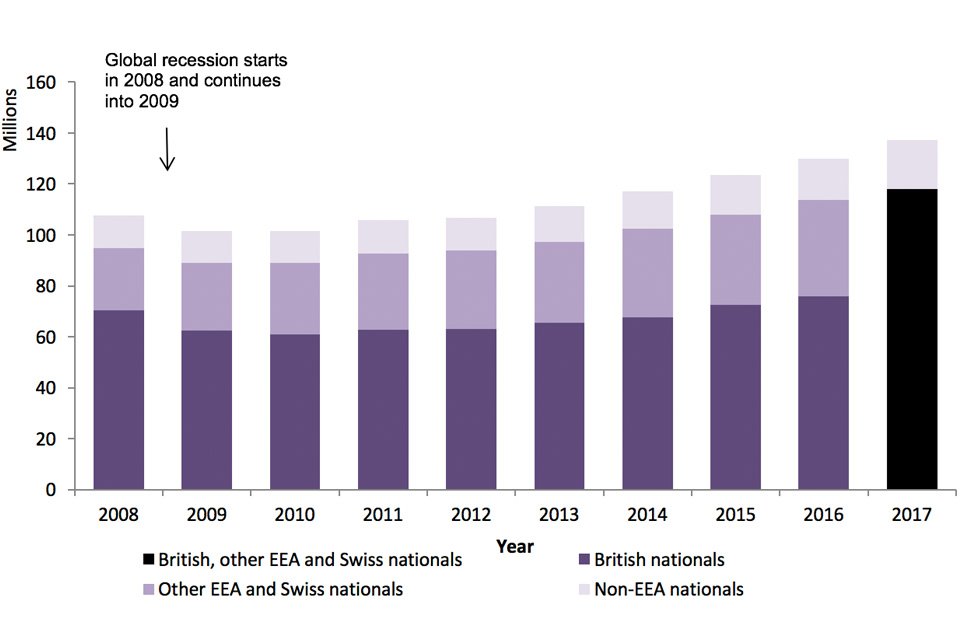
Source:
Table ad 01 (Admissions tables).
2. Entry clearance visa applications and outcomes, by visa type, year ending March 2018
The following diagram illustrates the type and volume of visas granted in the year ending March 2018. As noted the volume of visas granted is much lower than non-EEA arrivals as some nationalities do not need a visa (for a visit of 6 months or less) to enter the UK.
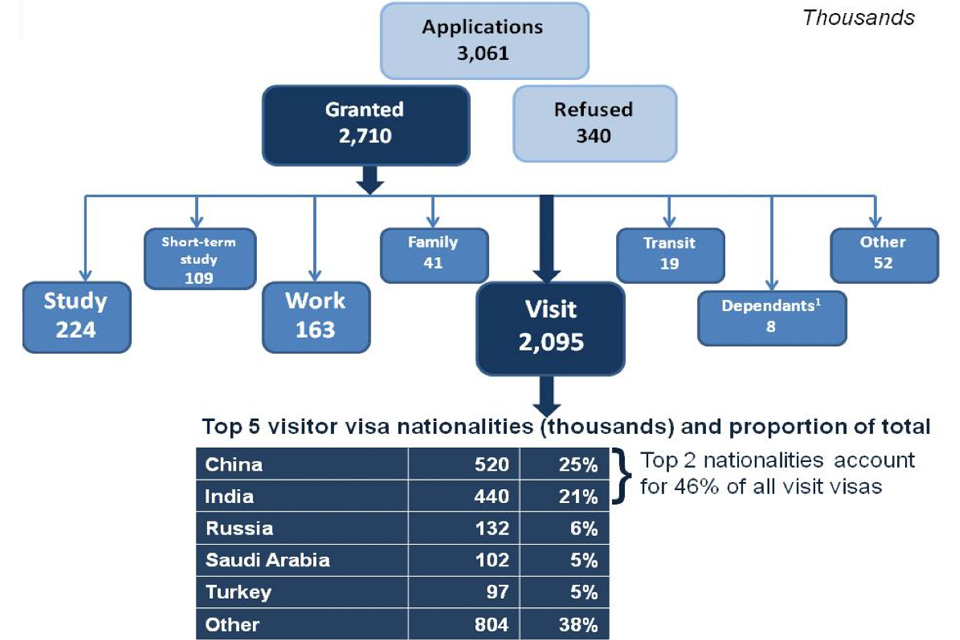
Sources:
Table vi 01 q (Entry clearance visas tables, volume 1).
Table vi 06 q o (Entry clearance visas tables, volume 3).
Chart note:
- Dependants joining or accompanying.
3. Data tables
Further data on arrivals are available in Admissions tables ad 01 to ad 04.
Further data on Entry clearance visas and sponsored visa applications for the work, study and family routes (described further in the Work topic, Study topic and Family topic) can be found in the following tables:
Visas tables volume 1
Visas tables volume 2
Visas tables volume 3
Sponsorship tables