Study
Updated 3 March 2016

© Crown copyright 2016
This publication is licensed under the terms of the Open Government Licence v3.0 except where otherwise stated. To view this licence, visit nationalarchives.gov.uk/doc/open-government-licence/version/3 or write to the Information Policy Team, The National Archives, Kew, London TW9 4DU, or email: psi@nationalarchives.gov.uk.
Where we have identified any third party copyright information you will need to obtain permission from the copyright holders concerned.
This publication is available at https://www.gov.uk/government/statistics/immigration-statistics-october-to-december-2015/study
Valid: 25 February 2016 to 25 May 2016
Data relate to the calendar year 2015 and all comparisons are with the calendar year 2014, unless indicated otherwise.
Back to ‘Immigration statistics October to December 2015’ content page.
This is not the latest release. View latest release.
1.Key facts
In 2015 there were 210,348 Study-related visas granted, excluding the unsponsored short-term student category (formerly known as ‘student visitors’), a fall of 4% compared with 2014. Over the same period, the number of university-sponsored study visa applications (main applicants) fell slightly (-1% to 166,366), with a 7% increase for Russell Group universities to 75,634. There were falls for other sectors, notably a 17% fall for the Further Education (FE) sector to 15,982. Most of the fall in the further education sector’s sponsored visa applications since the peak in mid-2011 was accounted for by licenses which have since been revoked.
In the year ending September 2015, the ONS estimates that there were 117,000 non-EU long-term immigrants coming to study and who had an intention to remain a year or more, an 11% (-15,000) fall, though not statistically significant. Over the same period, the number of long-term (1 year or more) study-related visas granted (main applicants) was 5% lower at 138,533. Although the trends in the long-term estimates and comparable visa numbers can be very different, these most recent changes have resulted in the two series becoming much closer in the last year.
In the year ending September 2015, ONS also estimates that the number of non-EU former students who were long-term emigrants from the UK had fallen to 40,000, although the change was not statistically significant.
The top 5 nationalities accounted for 55% of the 210,348 study visas granted in 2015, with the largest number going to Chinese nationals (70,754 or 34% of the total). There were higher numbers of study visas granted, excluding the unsponsored short-term student category (formerly known as ‘student visitors’) for Chinese (+6,153 or +10%) and Egyptian (+336; +26%) nationals; and fewer Libyan (-2,442; -66%), Iraqi (-2,384; -68%) and Brazilian (-1,925; -45%) nationals.
Study-related grants of extensions fell a fifth (-20%) to 63,473 in 2015. Corresponding sponsored applications data (main applicants) showed a 23% fall, with two thirds of the fall due to fewer applications for the Further Education sector. These trends are likely to reflect previous falls in the visas granted and tightening of the rules such as the new use of the “genuineness” test from October 2013.
The Migrant Journey Sixth Report indicated that, based on data matching, around one sixth (17%) of migrants issued a study visa in 2009 had valid leave to remain in the UK or had been granted settlement 5 years later. This proportion has decreased in each cohort arriving, from 24% of those issued a study visa in 2004.
2.Study immigration: latest trends
| 2014 | 2015 | Change | Percentage change | |
| Study-related visas granted Excluding short-term students (1) | 220,041 | 210,348 | -9,693 | -4% |
| of which (Top 5): | ||||
| China | 64,601 | 70,754 | +6,153 | +10% |
| United States | 13,989 | 14,143 | +154 | +1% |
| India | 12,600 | 11,161 | -1,439 | -11% |
| Malaysia | 10,729 | 9,868 | -861 | -8% |
| Nigeria | 10,488 | 9,528 | -960 | -9% |
| Short-term study visas (1)(main applicants only) | 73,607 | 62,626 | -10,981 | -15% |
| Year ending September 2014 | Year ending September 2015 | Change | Percentage change | |
| Long-term immigration for study Excluding dependants (2) | 132,000 | 117,000 | -15,000 | -11% |
| Long-term (1 year or more) study-related visas Excluding dependants | 145,113 | 138,533 | -6,580 | -5% |
Table notes
Source: Home Office, Immigration Statistics October to December 2015 Visas table vi 04, vi 06 q s, International Passenger Survey, Office for National Statistics Migration Statistics Quarterly Report.
(1) The Short-term study category (previously described as ‘student visitor’) allows individuals to come to the UK for 6 months (or 11 months if they will be studying an English Language course) and cannot extend their stay (further details at Short-term study visit visa. For consistency and comparability over time Short-term study visas have been excluded from study-related totals.
(2) Immigration for study data are estimates of the number of non-EU nationals intending to change their residence to the UK for at least 12 months based on the International Passenger Survey.
3.Long-term trends in student immigration
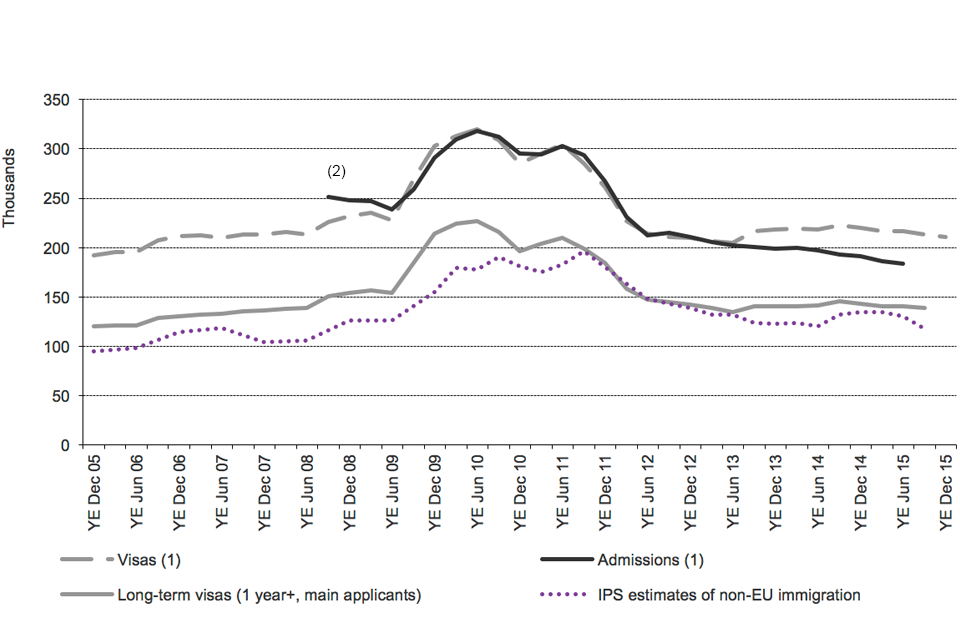
Chart notes
Source: Home Office, Immigration Statistics October to December 2015, Visas tables vi 04 q(Visas volume 1), Admissions table ad 02 q and corresponding datasets; Office for National Statistics Migration.
(1) Excludes ‘short-term students’ (previously referred to as ‘student visitors’) who are allowed to come to the UK for 6 months (or 11 months if they will be studying an English Language course) and cannot extend their stay. A proportion of Tier 4 student visas are also short-term (under 1 year), see Entry clearance visas by length but are not included within the ‘short term students’ category.
(2) Prior to the year ending September 2008, the count of student admissions is not comparable as there was no specific admissions category for ‘short-term students’ (previously referred to as ‘student visitors’) who may then have been recorded as either students or visitors.
The above chart shows that IPS long-term immigration estimates, while being substantially lower as they cover only those intending to remain a year or more. In the latest quarter, the numbers of study visas of a year or more and the IPS estimates for long-term migration are almost identical, although that has not always been the case.
There are a range of potential reasons why IPS figures for long-term migrants may be different from figures for study visas granted or passenger arrivals, and hence why the trends in the different series do not match, including:
- sampling variation in the IPS (for example, the fall of 15,000 in study-related immigration for the year ending September 2015 had an estimated confidence interval of +/-21,000)
- IPS data for study relate to individuals whose main reason for migration was study so (unlike visas data) are likely to exclude their dependants. IPS data are likely to be more comparable with visa totals for main applicants than with the total for all study-related visas (eg including dependants)
- differences between intentions and visa length
- individuals may migrate for multiple different reasons
- timing differences between when visas are granted and when an individual actually travels
- visa and admissions data include dependants, and both short-term and long-term migrants
Further comparison of the data is described in the ONS publication International student migration - what do the statistics tell us? and the User Guide.
4.Register of sponsoring educational institutions
On 4 January 2016, there were 1,404 educational institutions on the UK Visas and Immigration register of sponsoring educational institutions. This was 4% lower than the number on 30 September 2015 (1,466), and 11% lower than a year earlier (31 December 2014, 1,570) which continues the reduction in numbers seen since the published series began in October 2011 (2,370). The decrease in the number of sponsoring educational institutions is consistent with the introduction of new accreditation criteria and conditions of status for educational sponsors from April 2011.
5.Sponsored study visa applications by education sector
The number of study-related sponsored visa applications (main applicants) fell 3% in 2015 to 201,763, compared with the previous 12 months (208,423). The trends are different in the four main sectors. There was a small fall in sponsored visa applications for the university sector (to 166,366; -1%), with a 7% increase for Russell Group universities to 75,634. There were larger falls in the further education sector (to 15,982; -17%) and English Language schools (to 2,930; -13%), and a small fall in the independent schools sector (to 13,675; -3%).
Study-related sponsored visa applications by sector
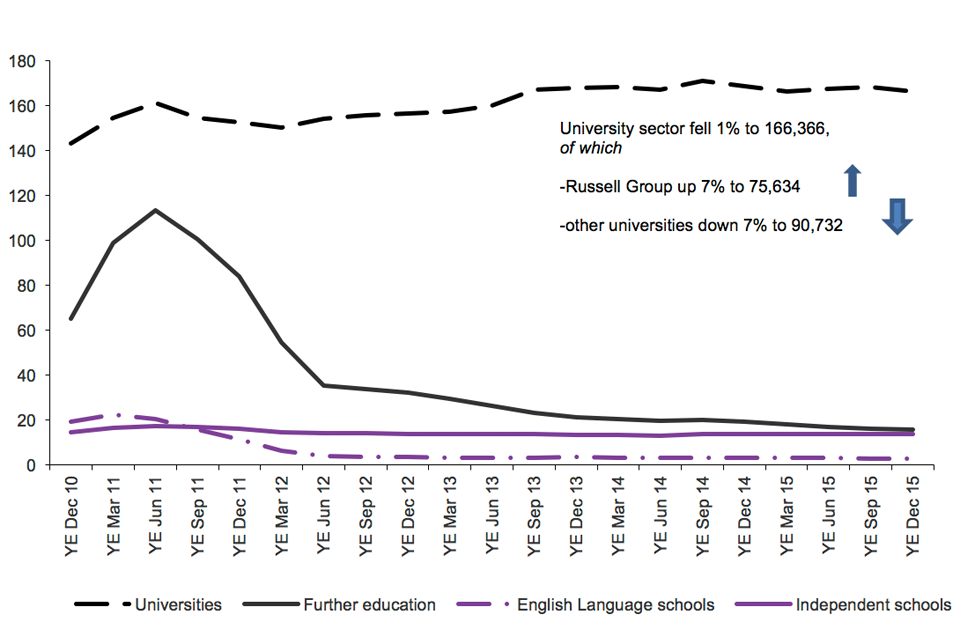
Chart notes
Source: Home Office, Immigration Statistics October to December 2015, Sponsorship table cs 09 q “Universities” relate to UK-based Higher Education Institutions. “Further education” relates to tertiary, further education or other colleges.
5.1New entrants to UK Higher Education
Between the 2013 to 2014 and 2014 to 2015 academic years the Higher Education Statistics Authority reported that the number of non-EU new entrants to universities decreased by 3% (to 174,305 students). There was no significant change in the number of UK new entrants (756,595), whilst other EU new entrants increased by 1% (to 57,815). Over the last five years, comparing 2014 to 2015 with 2009 to 2010, the number of non-EU students has increased by 8% and there have been falls of 21% and 10% for UK and other EU students respectively (Source: HESA). ‘Higher Education Student Enrolments and Qualifications Obtained at Higher Education Providers in the United Kingdom 2014/15’.
6. Immigration for study, and emigration of former students
In the year ending September 2015, the ONS estimates that there were 117,000 non-EU long-term immigrants coming to study and who had an intention to remain a year or more, an 11% (-15,000) fall, though not statistically significant compared with the previous 12 months.
By contrast, in the year ending September 2015, ONS also estimates that the number of non-EU former students who were long-term emigrants from the UK had fallen to 40,000, although this was not a statistically significant decrease from 48,000 in the previous 12 months.
Source: ONS, International Passenger Survey Migration Statistics Quarterly Report
7. Extensions of stay
Study-related grants of extensions fell by a fifth (-20%) to 63,473 in 2015, compared with the 2014 (79,778). This followed a fall from 140,151 in 2010 to 117,810 in 2013. The 63,473 extensions included 413 grants under the Tier 4 Doctorate Extension Scheme introduced on 6 April 2013.
The fall in grants of extensions of stay is likely to reflect previous falls in the numbers granted visas, particularly to applicants in further education, together with tightening of the rules such as the new use of the “genuineness” test for study (Tier 4) extensions of stay, announced on 6 September 2013 ‘Statement of Changes in Immigration Rules’.
Looking at individuals’ previous category, an estimated 74,761 former students (main applicants) were granted extensions in 2014 (the latest available data for this analysis), compared with 112,432 for 2013. Of the extensions granted in 2014, the majority (84%) allowed individuals to continue to study, an increase from 65% granted for this purpose in 2011. The fall in proportion of students allowed to switch largely reflects the closure of the Post-Study route.
Conversely, the proportion granted for Tier 2 skilled work has increased from 1% in 2011 to 8% in 2014.
Extensions granted to former students (by current category of grant) 2011 to 2014 (main applicants)
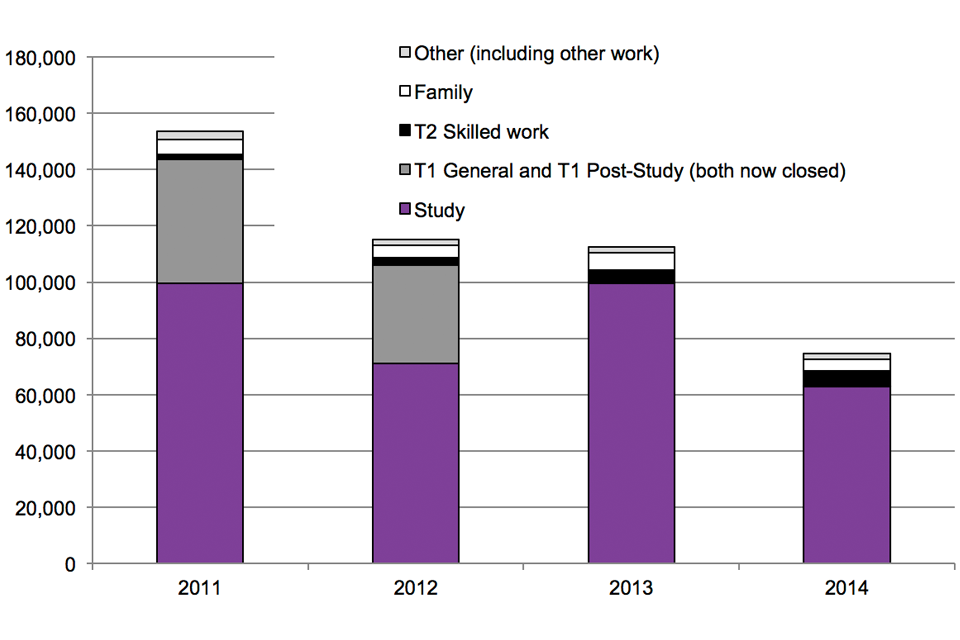
Chart notes
Source: Home Office, Immigration Statistics October to December 2015, Extensions table expc 01 and expc 01 w.
Note that ‘short-term students’ are normally only allowed to stay for up to 6 months (11 months for English Language schools) and cannot extend their stay.
The number of study-related sponsored applications for extensions (main applicants) fell by 23% (-16,744) to 56,297. Much of the 16,744 drop was accounted for by a fall of two-thirds (-66%) in the further education sector (-9,626). There were also falls for universities (-6,111), Independent schools (-324) and for English language schools (-168).
8.‘Short-term students’
The ‘short-term student’ category (previously referred to as ‘student visitors’) includes significant numbers admitted for up to 6 months as non-visa nationals without a visa. Visas are granted for a maximum of 6 months in duration or in a very small number of cases for 11 months if studying an English Language course. ‘Short-term students’ are not counted as long-term migrants and cannot extend their stay, so they are not included within the references to study visas in this section. Additionally some students in the study category (Tier 4 of the Points Based System) have short-term visas (under 1 year), see Entry clearance visas by length but are not included within the ‘short term students’ category.
There were 279,000 ‘short-term student’ admissions in the calendar year 2014, much higher than the numbers of student visitor visas granted (73,607 over the same period). This is due to many of the top 10 nationalities for student visitor admissions being non-visa nationalities (including the United States and Brazil). For example US, Brazil, and Japan accounted for 121,000, 19,100 and 17,200 respectively of the 279,000 student visitors admitted to the UK in 2014. Such nationals do not need to obtain a visa if they wish to come to the UK as a short-term student for up to a maximum of 6 months.
The number of ‘short-term student’ visas granted fell by 15% to 62,626 in 2015, after previously having doubled from 37,703 in 2009 to 77,601 in 2013. For further information on short-term students see Short-term study visa and the Home Office research report ‘Student visitors’.
9. Staying on in the UK
Analysis of administrative records for migrants granted visas in 2009 is presented in the Migrant Journey Sixth Report and shows that around one sixth (17%) of migrants issued a study visa in 2009 had valid leave to remain in the UK or had been granted settlement 5 years later. This proportion has decreased in each cohort arriving, from 24% of those issued a study visa in 2004.
The proportion of migrants who gained settlement within 5 years of entering on a study visa also declined over the same period. For people issued a study visa in 2004, 3% had gained settlement 5 years later, compared with just 1% of those issued a study visa in 2009.
These changes are consistent with the tightening of the Immigration Rules for students since September 2007. They may also be partly related to the economic recession that occurred towards the end of the period analysed here, which may have reduced the incentive for students to remain and seek work in the UK. The study group reported on here excludes student visitor visas that cannot be extended and normally have validity of 6 months or in some cases up to 11 months.
Source: Home Office, Migrant Journey Sixth Report.
10.Data tables
Data on student immigration, sourced from Home Office administrative systems, can be found in the following tables:
Sponsorship: Tables cs 07 q to cs 14 q
Visas vol. 1: Tables vi 01 q, vi 04 and v1 04 q
vi 01 q Entry clearance visa applications and resolution by category
vi 04 Entry clearance visas granted by category
vi 04 q Entry clearance visas granted by category
Visas vol. 3: Tables vi 06 q s
vi 06 q s Entry clearance visas granted by category and country of nationality: Study
Admissions: Tables ad 02 to ad 03 and ad 03 s
Extensions: Tables ex 01 to ex 02 s
Provisional estimates of long-term immigration for formal study from the ONS International Passenger Survey (IPS) relate to those whose main reason for migration is formal study and so are likely to exclude dependants (who would be more likely to say their main reason was to ‘accompany or join’ rather than formal study).ONS data is published at Migration Statistics Quarterly Report.
The Higher Education Statistics Agency publishes data on new entrants to UK Higher Education providers.
11.Background information
This section includes figures on study-related visas granted, passenger arrivals and extensions granted for non-EEA nationals. It also includes figures on long-term immigration to study (i.e. those intending to stay for at least 12 months to study) for non-EU nationals.
Data include dependants as well as main applicants unless stated otherwise. Estimates of long-term immigration for study from the ONS International Passenger Survey (IPS) relate to those whose main reason for migration is to study and so are likely to exclude dependants (who would be more likely to say their main reason was to ‘accompany or join’ rather than to study). All comparisons are with the previous 12 months unless indicated.