Why do people come to the UK? (3) To study
Published 25 May 2017

© Crown copyright 2017
This publication is licensed under the terms of the Open Government Licence v3.0 except where otherwise stated. To view this licence, visit nationalarchives.gov.uk/doc/open-government-licence/version/3 or write to the Information Policy Team, The National Archives, Kew, London TW9 4DU, or email: psi@nationalarchives.gov.uk.
Where we have identified any third party copyright information you will need to obtain permission from the copyright holders concerned.
This publication is available at https://www.gov.uk/government/statistics/immigration-statistics-january-to-march-2017/why-do-people-come-to-the-uk-3-to-study
Back to Immigration statistics January to March 2017 content page.
This is not the latest release. View latest release.
Data relate to the year ending March 2017 and all comparisons are with the year ending March 2016, unless stated otherwise.
According to the latest figures from the Organisation for Economic Co-operation and Development (OECD), between 2009 and 2013 the UK maintained the second largest international student market share behind the USA. In addition, Home Office figures show that, after visitors, study is the most common reason for visas granted to non-EEA nationals.
Home Office figures in this section relate to study visa applications and grants for non-EEA nationals.
The Higher Education Statistics Agency publishes data on new entrants to UK higher education providers. The ONS publish figures on long-term immigration to study (i.e. those intending to stay for at least 12 months to study) for EU and non-EU nationals. ONS data is published in the Migration Statistics Quarterly Report.
1. Key facts
Aside from visitors, the most common visa granted was for study (8% of all visas granted).
In the year ending March 2017, there were 208,906 study-related visas granted, 1% more than the previous year. There were increases for Chinese (+6,778; +10%) and Indian (+938; +9%) nationals but falls for Nigerian (-2,257; -26%), Malaysian (-1,516; -16%), and Brazilian (-1,499; -65%) nationals.
Over the same period, the number of university-sponsored study visa applications (main applicants) rose by 3% to 168,591 and there was a 7% increase for Russell Group universities to 80,664. There were continued falls for the Further education (6% to 14,534), and Independent school (1% to 13,379) sectors, but a rise in the English language school (11% to 2,955) sector. Most of the fall in the Further Education sector’s sponsored visa applications since the peak in mid-2011 can be accounted for by licenses which have since been revoked.
In the year ending December 2016, the Office for National Statistics (ONS) estimated there were 92,000 non-European Union (EU) long-term immigrants coming to study with an intention to remain a year or more and 40,000 non-EU former students departing. Although they relate to different cohorts of students, the difference between these figures is around 52,000. The visa numbers above are also higher because they will include short term migrants, dependants, and those who do not travel.
In 2016, there were 44,398 extensions granted (main applicants) to former students, a fall of 31% compared with 2015, likely reflecting previous rule changes. Most of the 44,398 grants were for further study (35,572) or Tier 2 skilled work (5,143).
2. Study immigration: latest trends
| Year ending March 2016 | Year ending March 2017 | Change | Percentage change | |
|---|---|---|---|---|
| Study-related visas granted, excluding short-term study category (1) | 206,125 | 208,906 | +2,781 | +1% |
| of which (Top 5): | ||||
| China | 70,512 | 77,290 | +6,778 | +10% |
| United States | 13,970 | 14,268 | +298 | +2% |
| India | 10,704 | 11,642 | +938 | +9% |
| Hong Kong | 9,021 | 9,041 | +20 | +0% |
| Saudi Arabia | 8,740 | 8,494 | -246 | -3% |
| Short-term study visas (1) (main applicants only) | 64,780 | 89,801 | +25,021 | +39% |
| Year ending December 2015 | Year ending December 2016 | Change (2) | Percentage change | |
| Long-term non-EU immigration for study, excluding dependants (2) | 112,000 | 92,000 | -20,000 | -18% |
| Long-term (1 year or more) study-related visas, excluding dependants | 137,461 | 141,248 | +3,787 | +3% |
Table notes
Source: Home Office, Immigration Statistics January to March 2017, Visas table vi 04 q, Visas volume 1 and Visas table vi 06 q s, Visas volume 3,, International Passenger Survey (IPS); ONS Migration Statistics Quarterly Report.
(1) The short-term study category (previously described as Student visitor) allows individuals to come to the UK for 6 months (or 11 months if they will be studying an English language course) and cannot extend their stay (further details at Short-term study visa. For consistency and comparability over time, short-term study visas have been excluded from study-related totals.
(2) The fall of 20,000 in non-EU study-related immigration for the year ending December 2016 had an estimated confidence interval of +/-20,000.
(3) Immigration for study data are estimates of the number of non-EU nationals intending to change their residence to the UK for at least 12 months based on the IPS.
3. Long-term trends in student immigration
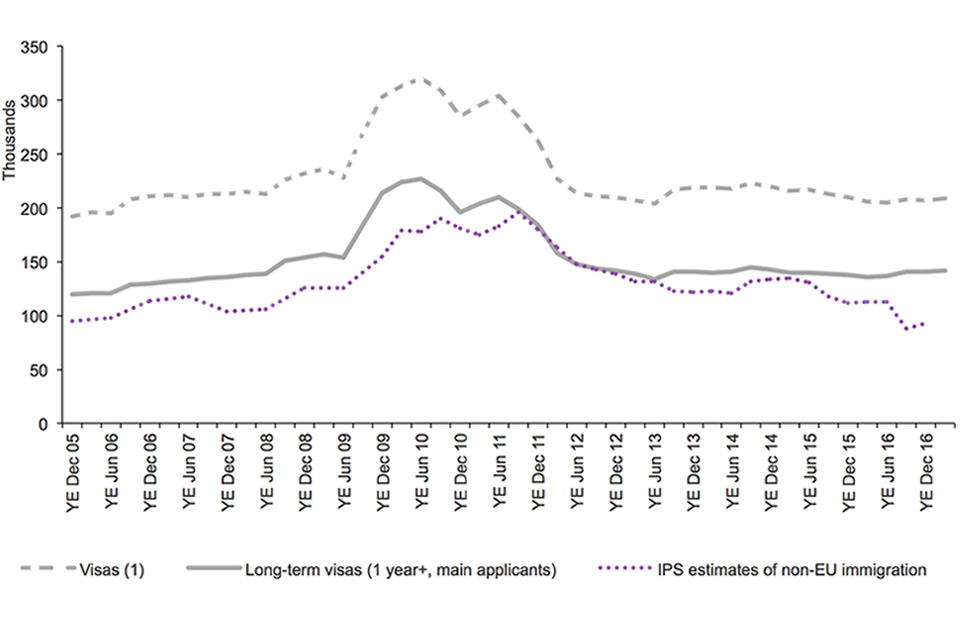
Chart notes
Source: Home Office, Immigration Statistics January to March 2017, Visas tables vi 04 q, Visas volume 1 and corresponding datasets; ONS Migration Statistics Quarterly Report.
(1) Excludes short-term students (previously referred to as Student visitors) who are allowed to come to the UK for 6 months (or 11 months if they will be studying an English language course) and cannot extend their stay.
4. Sponsored study visa applications by education sector
The number of study-related sponsored visa applications (main applicants) rose by 2% in the year ending March 2017 to 202,042, compared with the previous 12 months (198,481). There was a rise of 3% to 168,591 in sponsored visa applications for the University sector as a whole, and this included a 7% increase for Russell Group universities to 80,664 but a 1% decrease for other universities to 87,927. Over the longer term, the number of visa applications to study at universities has been broadly flat since 2013.
In the latest 12 months, there was a rise in English language schools (11% to 2,955) along with falls in the Further education (6% to 14,534) and Independent school (1% to 13,379) sectors.
4.1 Study-related sponsored visa applications by sector
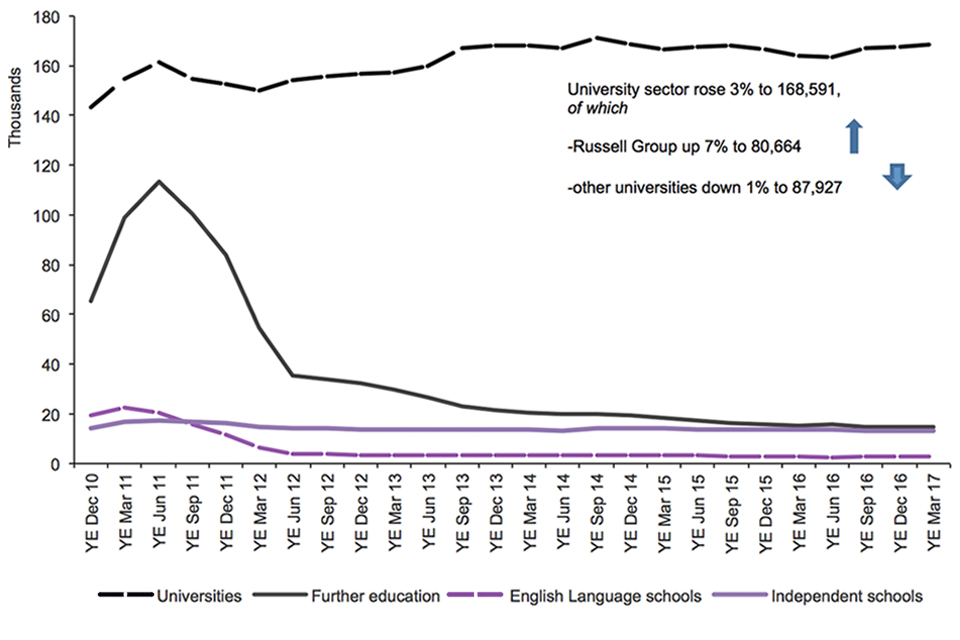
Chart notes
Source: Home Office, Immigration Statistics January to March 2017, Sponsorship table cs 09 q.
‘Universities’ relate to UK-based higher education institutions.
‘Further education’ relates to tertiary, further education or other colleges.
5. Short-term study
There were also 295,000 short-term student category admissions in the year ending June 2016, much higher than the numbers of short-term student category visas granted (82,318 over the same period). This was due to many short-term student admissions being from nationalities (including a large number of American student visitors) who are not required to obtain a visa if they wished to come to the UK as a short-term student.
6. Data tables
Data on student immigration, sourced from Home Office administrative systems, can be found in the following tables:
Sponsorship tables
Visas tables volume 1
Visas tables volume 2
Visas tables volume 3
Admissions tables
Extensions tables