Visas
Updated 26 May 2016

© Crown copyright 2016
This publication is licensed under the terms of the Open Government Licence v3.0 except where otherwise stated. To view this licence, visit nationalarchives.gov.uk/doc/open-government-licence/version/3 or write to the Information Policy Team, The National Archives, Kew, London TW9 4DU, or email: psi@nationalarchives.gov.uk.
Where we have identified any third party copyright information you will need to obtain permission from the copyright holders concerned.
This publication is available at https://www.gov.uk/government/statistics/immigration-statistics-january-to-march-2016/visas
Valid: 26 May 2016 to 24 August 2016
Data relate to the year ending March 2016 and all comparisons are with the year ending March 2015, unless indicated otherwise.
Back to ‘Immigration statistics January to March 2016’ content page.
This is not the latest release. View latest release.
1. Key facts
There were 531,375 visas granted (excluding visitors and transit) in the year ending March 2016, a fall of 11,931 (-2%). This fall was driven by lower numbers in sponsored (Tier 4) Study (-10,210), Work (-7,167) and Short-term study (-3,972) categories. There were increases in the Other category (+7,382, of which EEA Family permits +4,489) and Family category (+3,682). Most of the fall in work visas related to Youth mobility and temporary work (-2,748) and Tier 1 investor visas (-2,106), reflecting changes introduced in November 2014. Skilled work visas fell 1% (-1,228).
The nationalities granted the most visas (excluding visitors and transit) were Chinese (92,715; excluding Hong Kong), Indian (84,663) and US (34,278).
There were 35,072 (+2%) more visitor visas granted at around 1.9 million. There were notable increases in visitor visa grants for Chinese nationals, up 22% (+72,611 to 406,669, excluding Hong Kong), and Indian nationals, up 13% (+43,487 to 373,299). By contrast there were large falls in visitor visa grants for Russian nationals (-49,014 to 104,360), down 32%.
2. Visas granted by reason (excluding visitor and transit visas)
| Year | Total granted (1) | Work | Study | Short-term study (2) | Family | Dependant joining or accompanying | Other |
|---|---|---|---|---|---|---|---|
| Year ending March 2011 | 609,337 | 161,809 | 295,086 | 51,137 | 51,759 | 15,690 | 33,856 |
| Year ending March 2012 | 529,901 | 148,589 | 226,556 | 65,361 | 43,732 | 13,072 | 32,591 |
| Year ending March 2013 | 499,552 | 141,752 | 206,736 | 69,516 | 36,858 | 11,685 | 33,005 |
| Year ending March 2014 | 537,686 | 156,322 | 218,908 | 79,384 | 35,207 | 11,651 | 36,214 |
| Year ending March 2015 | 543,306 | 171,024 | 216,372 | 68,770 | 34,592 | 10,899 | 41,649 |
| Year ending March 2016 | 531,375 | 163,857 | 206,162 | 64,798 | 38,274 | 9,253 | 49,031 |
| Change: latest year | -11,931 | -7,167 | -10,210 | -3,972 | +3,682 | -1,646 | +7,382 |
| Percentage change | -2% | -4% | -5% | -6% | +11% | -15% | +18% |
Table notes
(1) Excludes visitor and transit visas.
(2) The Short-term study category (previously described as ‘student visitor’) allows individuals to come to the UK for 6 months (or 11 months if they will be studying an English Language course) and cannot extend their stay (further details at Short-term study visa). For consistency and comparability over time Short-term study visas have been excluded from study-related totals.
3. Visas granted by nationality
The map below illustrates the top 10 nationalities granted visas, excluding visitor and transit visas, in the year ending March 2016, which account for 61% of the total 531,375. More detailed commentary on visa statistics by reason and nationality is included in the Work topic, Study topic, and Family topic.
Top 10 nationalities granted visas
(Total 531,375; excluding visitor and transit visas)
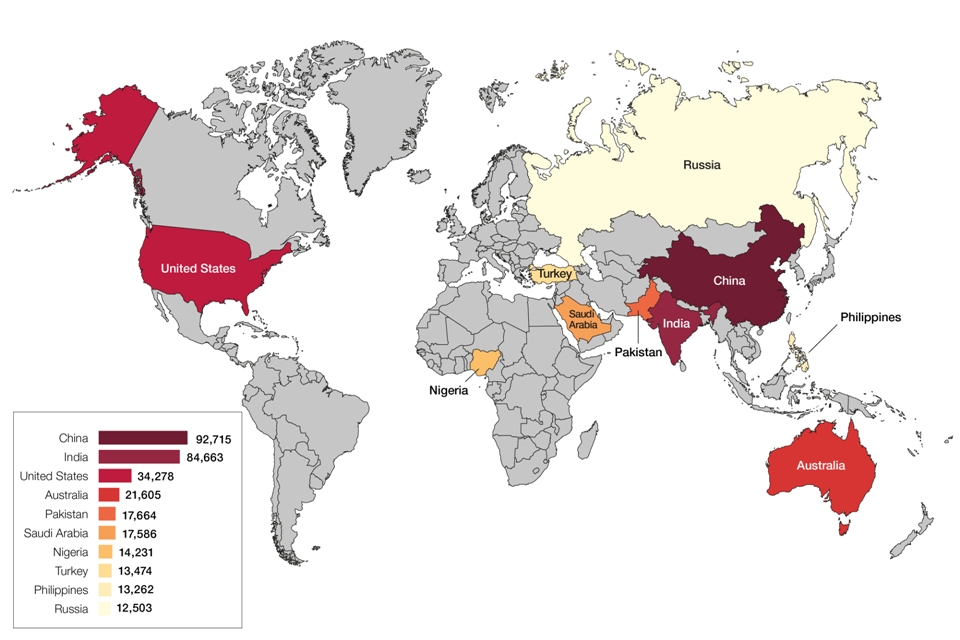
Chart notes
Source: Home Office, Immigration Statistics January to March 2016, Visas table vi 06 q, Visas vol. 2.
(1) China excludes Hong Kong.
4. Largest increases and falls in visitor visa grants by nationality
| Increasing | Change | % Change | Decreasing | Change | % Change | |
|---|---|---|---|---|---|---|
| China | +72,611 | +22% | Russia | -49,014 | -32% | |
| India | +43,487 | +13% | Nigeria | -26,624 | -25% | |
| South Africa | +7,664 | +9% | Pakistan | -10,934 | -20% | |
| Saudi Arabia | +5,890 | +6% | Bangladesh | -5,775 | -39% | |
| Philippines | +2,393 | +7% | Iraq | -2,938 | -52% |
Table notes
Omani, Qatari and UAE nationals were able to visit the UK without a visa from 1 January 2014 (the Electronic Visa Waiver scheme was introduced on 1 January 2014 resulting in significant falls for these nationalities). This scheme was extended to Kuwaiti nationals from 21 February 2016.
Source: Home Office, Immigration Statistics January to March 2016, Visas table vi 06 q o, Visas vol. 3.
5. Data tables
Further data on entry clearance visas and sponsored visa applications for the work and study routes (described further in the Work topic and Study topic) can be found in the following tables:
Visas vol. 1: tables vi 01 q to vi 05 q
The following tables are included in this volume:
vi 01 q Entry clearance visa applications and resolution by category
vi 02 q Entry clearance visa applications and resolution by country of nationality
vi 03 Entry clearance visa applications by country of nationality
vi 04 Entry clearance visas granted by category
vi 04 q Entry clearance visas granted by category
vi 5 Entry clearance visas granted by country of nationality
vi 5 q Entry clearance visas granted by country of nationality
Visas vol. 2: tables vi 06 q and vi 06 q w
The following tables are included in this volume:
vi 06 q Entry clearance visas granted by category and country of nationality: Summary
vi 06 q w Entry clearance visas granted by category and country of nationality: Work
Visas vol. 3: tables vi 06 q s to vi 06 q o
The following tables are included in this volume:
vi 06 q s Entry clearance visas granted by category and country of nationality: Study
vi 06 q f Entry clearance visas granted by category and country of nationality: Family
vi 06 q d Entry clearance visas granted by category and country of nationality: Dependant joining or accompanying
vi 06 q o Entry clearance visas granted by category and country of nationality: Other
Sponsorship: tables cs 01 to cs 14 q
6. Background information
This section relates to grants of entry clearance visas to individuals outside the UK. Data include dependants and exclude visitor and transit visas unless stated otherwise.