Citizenship
Updated 26 May 2016

© Crown copyright 2016
This publication is licensed under the terms of the Open Government Licence v3.0 except where otherwise stated. To view this licence, visit nationalarchives.gov.uk/doc/open-government-licence/version/3 or write to the Information Policy Team, The National Archives, Kew, London TW9 4DU, or email: psi@nationalarchives.gov.uk.
Where we have identified any third party copyright information you will need to obtain permission from the copyright holders concerned.
This publication is available at https://www.gov.uk/government/statistics/immigration-statistics-january-to-march-2016/citizenship
Valid: 26 May 2016 to 24 August 2016
Data relate to the year ending March 2016 and all comparisons are with the year ending March 2015, unless indicated otherwise.
Back to ‘Immigration statistics January to March 2016’ content page.
This is not the latest release. View latest release.
1. Key facts
Applications for British citizenship increased by 13% in the year ending March 2016 to 152,239 but were 34% (-80,023) lower than the peak of 232,262 in 2013.
There were 148,497 British citizenship decisions, 22% more than in the previous 12 months (121,339). Numbers granted British citizenship increased by 17% (+ 19,119 to 134,659) while refusals and withdrawals increased by 139% (+8,039 to 13,838).
Grant rates fell from 95% in the year ending March 2015 to 91% in the year ending March 2016 following the introduction of enhanced checks on cases requiring higher levels of assurance in April 2015, e.g. those cases with previous asylum refusals and cases with adverse immigration histories.
The 19,119 increase in grants of British citizenship reflects increases in numbers of people granted citizenship in all broad categories.
Year-on-year comparisons of numbers of decisions can be affected by changes in resources and the mix of cases as well as policy changes.
2. Grants and refusals of citizenship
| Year | Total decisions | Total grants | On basis of residence | On basis of marriage | As children | Other grounds | Refusals and withdrawals |
|---|---|---|---|---|---|---|---|
| Year to March 2012 | 181,832 | 175,267 | 95,625 | 34,384 | 40,512 | 4,746 | 6,565 |
| Year to March 2013 | 202,742 | 195,642 | 107,146 | 39,663 | 43,586 | 5,247 | 7,100 |
| Year to March 2014 | 214,981 | 206,852 | 112,380 | 46,893 | 43,413 | 4,166 | 8,129 |
| Year to March 2015 | 121,339 | 115,540 | 56,632 | 23,533 | 31,066 | 4,309 | 5,799 |
| Year to March 2016 | 148,497 | 134,659 | 68,415 | 28,323 | 32,508 | 5,413 | 13,838 |
| Change: latest year | 27,158 | 19,119 | 11,783 | 4,790 | 1,442 | 1,104 | 8,039 |
| Percentage change | +22% | +17% | +21% | +20% | +5% | +26% | +139% |
Table notes
Source: Home Office, Immigration Statistics January to March 2016, Citizenship tables cz 01 q and cz 02 q.
‘Other grounds’ includes Entitlement and Discretionary registration as an adult, Entitlement and Discretionary registration on other grounds and registration under section 5 of the British Nationality Act 1981. See Table cz 07 and the user guide for more detail.
Total decisions in the year ending March 2016 rose by 22% (+ 27,158) due to an increase in decisions made during the first 3 months of 2016. In January to March 2016 58,254 decisions were made, 50% (+19,365) more than in the same period in 2015 (38,889).
3. Long-term trends in applications for and grants of citizenship
The chart below illustrates longer-term trends in applications for and grants of citizenship by calendar year.
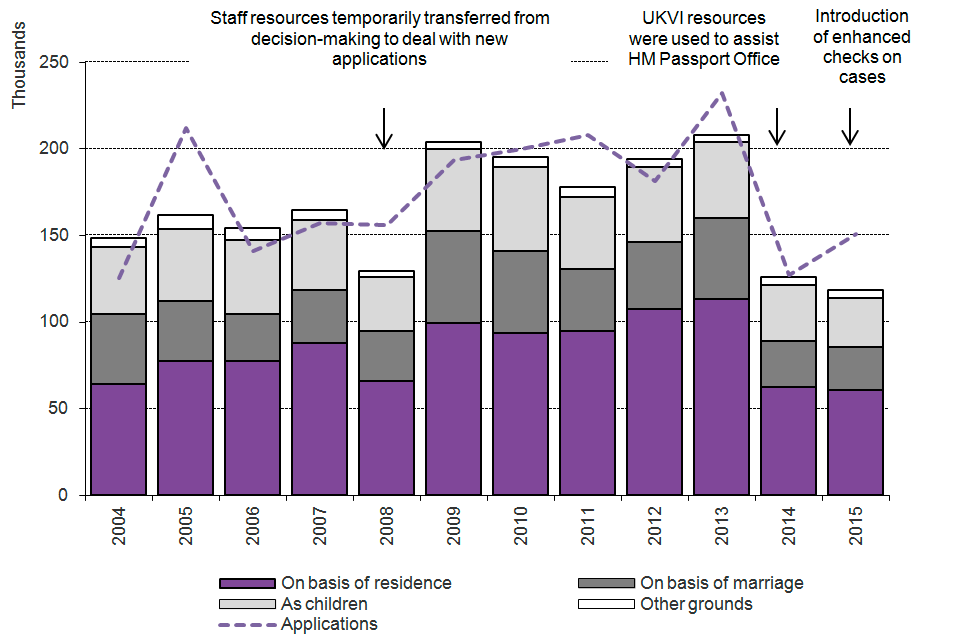
Chart notes
Source: Home Office, Immigration Statistics January to March 2016, Citizenship table cz 03.
The number of grants in 2015 (118,053) was the lowest since 2001 (90,282).
Between 2009 and 2013 there was a general increase in applications for and grants of citizenship, which is likely in part to reflect increased grants of permission to stay permanently (known as settlement) up to 2010. After a period of residence those granted settlement become eligible to apply for citizenship. The peak in grants of citizenship occurred in 2013, when there were 207,989 grants, more than double the level seen in 2001 (90,282) and the highest annual total since records began in 1962.
There were also increases in British citizenship applications made in 2005 (211,911) and 2013 (232,262). The increase in 2005 may have reflected people anticipating the introduction of the Knowledge of Life in the UK test on 1 November that year. Similarly, the increase in 2013 may, in part, have been due to some people anticipating the rule change to the English language element of the Life in the UK test as of 28 October 2013. See the Policy and Legislative Changes Timeline for further information. Applications in 2014 fell to 127,259, a level not seen since 2004 (125,668). This may partly be due to the rule change to the English language element of the Life in the UK test as of 28 October 2013 and fewer grants of settlement since 2010.
4. Previous nationalities granted citizenship
The chart below shows the top 5 previous nationalities granted citizenship.
(Total number of grants in 2015 - 118,053)
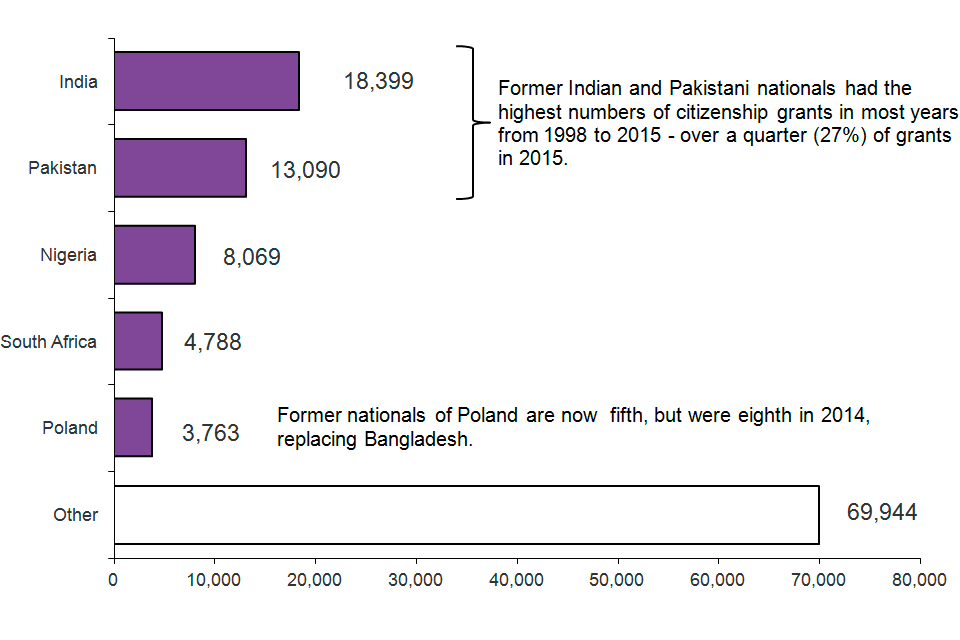
Chart notes
Source: Home Office, Immigration Statistics January to March 2016, Citizenship table cz 06.
Grants of citizenship to EU nationals, as a proportion of total grants, have increased since 2011. This is mainly due to increased grants to nationals of Poland and Romania.
Grants to all EU nationals, other than Bulgaria, Croatia and Austria, rose in 2015 compared to 2014. The countries that increased most were Poland (up 597 to 3,763), Italy (up 364 to 843), Greece (up 357 to 615), France (up 311 to 722), Germany (up 283 to 592) and Hungary (up 269 to 708).
| Total grants | Non-EU | EU nationals | EU nationals as % of total | |
|---|---|---|---|---|
| 2011 | 177,785 | 170,379 | 7,406 | 4% |
| 2012 | 194,209 | 183,674 | 10,535 | 5% |
| 2013 | 207,989 | 190,344 | 17,645 | 8% |
| 2014 | 125,653 | 115,582 | 10,071 | 8% |
| 2015 | 118,053 | 105,083 | 12,970 | 11% |
Table notes
Source: Home Office, Immigration Statistics January to March 2016, Citizenship tables cz 06.
Includes Croatia as EU throughout. See Table cz 06 and the user guide for more detail.
5. Data tables
Further data on British citizenship are available in Citizenship tables cz 01 to cz 10.
In addition to applications and detailed breakdowns of decisions, these include information on refusals, citizenship ceremonies attended and renunciations of citizenship.
6. Background information
The figures in this section relate to the number of people who are granted or refused British citizenship.
The numbers of decisions made are not always fully comparable over time. This is because, as well as reflecting changes in the levels of those settling in the UK, the figures are influenced by policy and legislative changes, for example, when changes are made to English language requirements or the Life in the UK test. In addition, the level of decisions made may be affected by the resources available in the Home Office.
6.1 Migration Transparency Data webpage
A range of key input and impact indicators are currently published by the Home Office on the Migration transparency data webpage.