Why do people come to the UK? (4) For family reasons
Published 24 August 2017

© Crown copyright 2017
This publication is licensed under the terms of the Open Government Licence v3.0 except where otherwise stated. To view this licence, visit nationalarchives.gov.uk/doc/open-government-licence/version/3 or write to the Information Policy Team, The National Archives, Kew, London TW9 4DU, or email: psi@nationalarchives.gov.uk.
Where we have identified any third party copyright information you will need to obtain permission from the copyright holders concerned.
This publication is available at https://www.gov.uk/government/statistics/immigration-statistics-april-to-june-2017/why-do-people-come-to-the-uk-4-for-family-reasons
Immigration Statistics April to June 2017 content page.
This is not the latest release. View latest release.
Data relate to the year ending June 2017 and all comparisons are with the year ending June 2016, unless indicated otherwise.
This section includes figures on family-related visas. It also includes estimates of non-EU long-term immigration to accompany or join (i.e. those intending to stay for at least 12 months to accompany or join others).
For figures on family-related grants of settlement as well as residence documentation issued to EEA nationals and their family members see How many people continue their stay in the UK?.
1. Key facts
The combined total number of family-related visas granted, including European Economic Area (EEA) family permits granted to non-EEA nationals, and visas granted to dependants of other visa holders (excluding visitors) fell by 6,400 (5%) to 130,569 in the year ending June 2017.
In the year ending March 2017, estimates from the International Passenger Survey (IPS) showed that 48,000 non-European Union (EU) nationals immigrated long term to the UK to accompany or join others, that is with the intention of staying for a year or more. This was not a statistically significant change on the previous year (47,000). However, statistics on those arriving to accompany or join others are not directly comparable with visa statistics.
2. Family immigration: latest trends
| Year ending June 2016 | Year ending June 2017 | Change | Percentage change | |
|---|---|---|---|---|
| Family-related visas granted | 38,649 | 36,892 | -1,757 | -5% |
| of which: | ||||
| Partners | 29,593 | 29,034 | -559 | -2% |
| Children (1) | 2,967 | 2,179 | -788 | -27% |
| Other dependants | 6,089 | 5,679 | -410 | -7% |
| All dependants on other visas (excl. Visitor visas) | 65,481 | 64,074 | -1,407 | -2% |
| EEA Family permits granted | 32,839 | 29,603 | -3,236 | -10% |
| Total (family-related visas granted, all dependants on other visas excl. Visitor visas, EEA Family permits granted) | 136,969 | 130,569 | -6,400 | -5% |
| Year ending March 2016 | Year ending March 2017 | Change (2) | Percentage change | |
|---|---|---|---|---|
| ONS estimates for non-EU long-term immigration to accompany or join others (3) | 47,000 | 48,000 | +1,000 | +2% |
Table notes
Source: Home Office, Immigration Statistics April to June 2017, Visas table vi 01 q (Visas volume 1), Office for National Statistics (ONS), Migration Statistics Quarterly Report.
(1) This category does not include children of a parent given limited leave to enter or remain in the UK for a probationary period. They are included in ‘All dependants on other visas (excl. visitor visas)’.
(2) The increase had an estimated confidence interval of +/-11,000.
(3) Immigration to accompany/join others data are estimates of the number of non-EU nationals intending to change their residence to the UK for at least 12 months based on the IPS. Latest 12 months for long-term immigration to accompany or join others data are to the year ending March 2017 and are provisional.
3. Long-term trends in family immigration
IPS estimates of non-EU immigration of those accompanying or joining others in the UK include those arriving on family visas, as well as persons accompanying those who are arriving for other reasons, such as for work or study.
The chart below shows that IPS estimates of immigration to accompany or join others have over the long term followed a broadly similar trend to the total number of visas granted by the Home Office through the family route and to other dependants. IPS estimates are substantially lower as they exclude people who come to the UK but intend to stay for less than a year. Both measures of immigration for family reasons / to accompany or join others have generally fallen over the long term since the year ending March 2007, albeit with short-term increases in 2010 and again in 2013.
Long-term trends in family immigration
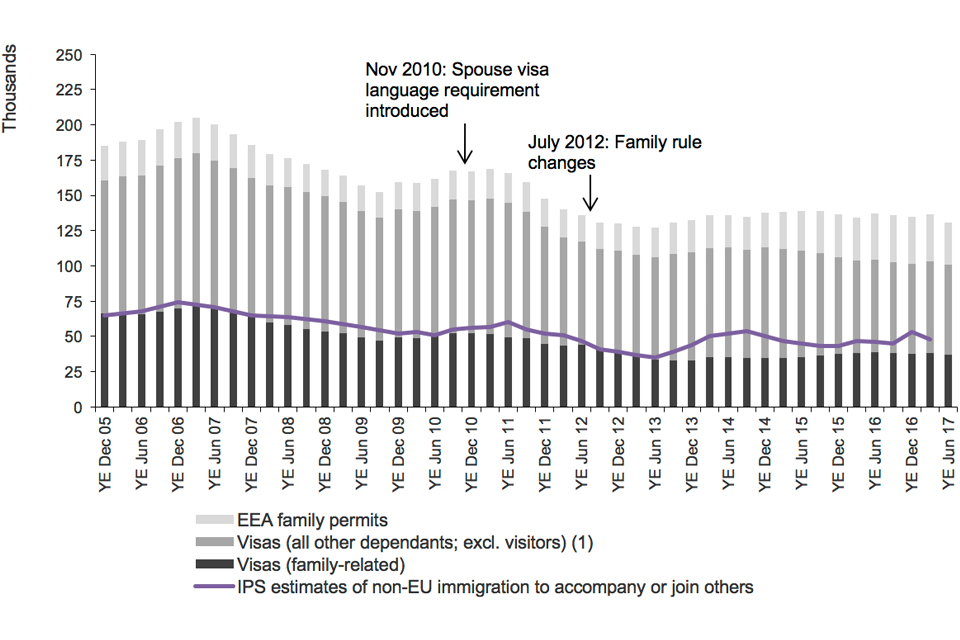
Chart notes
Source: Home Office, Immigration Statistics April to June 2017, Visas table vi 04 q (Visa volume 1); ONS (provisional estimates for year end to March 2017), Migration Statistics Quarterly Report.
(1) Includes all dependants (such as dependants for work and study), but excludes visitors.
4. Visas
There were 36,892 family-related visas granted in the year ending June 2017. This number does not include dependants of other migrants who are discussed below. Five nationalities accounted for almost two-fifths (39%) of family visas (see table below).
Nationalities with the highest number of visas granted for family reasons, year ending June 2017
| Total | Partners | Children (1) | Other (2) | Other (for immediate settlement) | |
|---|---|---|---|---|---|
| Family-related visas granted | 36,892 | 29,034 | 2,179 | 5,549 | 130 |
| of which: | |||||
| Pakistan | 6,187 | 5,925 | 98 | 149 | 15 |
| India | 2,718 | 2,545 | 158 | 1 | 14 |
| United States | 2,148 | 2,117 | 23 | 7 | 1 |
| Syria | 1,789 | 113 | 4 | 1,666 | 6 |
| Nepal | 1,452 | 942 | 508 | 0 | 2 |
Table notes
Source: Home Office, Immigration Statistics April to June 2017, Visas table vi 06 q f (Visas volume 3).
(1) This category does not include children of a parent given limited leave to enter or remain in the UK for a probationary period.
(2) Includes family reunion cases (pre-existing partners and minor children of persons granted refugee status or humanitarian protection). The relatively high numbers for Syrian nationals (Nearly one-third (30%) of all ‘Other’ cases) reflects large numbers of family reunion cases for that nationality.
In addition to a family visa, other dependants of non-family-related visas can be granted a visa to join or accompany migrants who have been granted the right to enter the UK for other purposes, such as to work or to study. In the year ending June 2017, 64,074 of these dependant visas (excluding visitors) were granted, a decrease of 2% compared with the previous 12 months (65,481) and 40% lower than the peak of 106,723 in the year ending March 2007. Of the 64,074 visas granted, 68% (43,299) were to dependants of workers, 20% (12,661) to dependants of students, and 13% (8,114) to other dependants accompanying or joining a migrant already in the UK.
There was also a decrease of 3,236 (10%) in EEA family permits issued abroad to 29,603, facilitating entry of non-EEA family members.
Within the Visa tables, family reunion applications from dependants of those with refugee status or humanitarian protection in the UK (made under Part 11 of the Immigration Rules) are included in the ‘Family: other’ category.
Whilst this ‘Family: other’ category includes a small number of other applications, the vast majority relate to family reunion and hence the published figures provide a good indication of trends for family reunion cases. A brief summary of the application types included in the ‘Family: other’ category can be found in the Visas and sponsorship section of the user guide.
Details of the application process and eligibility criteria for family reunion visas are given at Family reunion guidance.
Entry clearance visa applications and resolution: Family, other
| Year ending | Applications | Resolved | Granted | % | Refused | % | Withdrawn or lapsed |
|---|---|---|---|---|---|---|---|
| Year ending June 2013 | 5,938 | 5,824 | 3,778 | 65% | 1,922 | 33% | 124 |
| Year ending June 2014 | 5,668 | 6,779 | 4,961 | 73% | 1,712 | 25% | 106 |
| Year ending June 2015 | 6,791 | 6,510 | 3,930 | 60% | 2,420 | 37% | 160 |
| Year ending June 2016 | 9,340 | 9,791 | 5,913 | 60% | 3,810 | 39% | 68 |
| Year ending June 2017 | 7,768 | 8,516 | 5,549 | 65% | 2,916 | 34% | 51 |
| Change: latest 12 months | -1,572 | -1,275 | -364 | -894 | -17 | ||
| Percentage change | -17% | -13% | -6% | -23% | -25% |
Table notes
Source: Home Office, Immigration Statistics April to June 2017, Visas table vi 01 q (Visas volume 1).
The top 5 nationalities accounted for 75% of visas granted in the ‘Family: other’ category in the year ending June 2017.
Entry clearance visas granted by top 5 countries of nationality: Family, other
| Ranking year ending June 2017 (year ending June 2016) | Nationality | Year ending June 2016 | Year ending June 2017 | Change: latest 12 months | Percentage change |
|---|---|---|---|---|---|
| *Total | 5,913 | 5,549 | -364 | -6% | |
| of which: | |||||
| 1 (1) | Syria | 2,134 | 1,666 | -468 | -22% |
| 2 (3) | Eritrea | 755 | 987 | +232 | +31% |
| 3 (2) | Sudan | 775 | 815 | +40 | +5% |
| 4 (4) | Iran | 506 | 528 | +22 | +4% |
| 5 (7) | Somalia | 168 | 193 | +25 | +15% |
Table notes
Source: Home Office, Immigration Statistics April to June 2017, Visas table vi 06 q f (Visas volume 3).
5.Data tables
Data on family immigration, sourced from Home Office administrative systems, can be found in the following tables:
Visa tables volume 1
Visa tables volume 2
Visa tables volume 3
Admissions tables
Extensions tables
Settlement tables